5 must-know KPI metrics to grow your B2B business [bonus metrics included]

How does one business measure its performance correctly? What are the most important metrics?
If these questions made you uncomfortable and you immediately found yourself in a pitch-black cave, blindly searching the indication of KPI inscription on the wall - buckle up because we’re about to shine the light into this dark.
What is KPI?
KPI metrics (key performance indicators) are the targets that help measure the performance of your company and its growth. What differs KPIs from the rest of the business metrics is that KPIs are the key measures that will have the most impact on moving your business forward. Defining and analyzing them will allow your company to:
- Measure progress and success of every sector,
- Improve the strategies,
- Scale up business,
- Achieve more converted leads,
- Improve sales channels.
Without these metrics, you would wander blindly to the top of the success mountain, or worse, lead your business and generate leads with the gut feeling. Let’s talk about:
- Return on investment,
- Lifetime Value,
- Customer Retention and churn,
- The customer acquisition cost.
Stay tuned for the bonus one at the end of the article.
Before we jump into these metrics, let’s step back and take a look at what your first-party data and conversions are so we can cover the basics.
Using your first-party data
First-party data, also known as 1P data, is information you gather directly from your clients, customers, or audience.
It is the most valuable data for your company, so why not use it?
According to Seagate Technology’s survey of 1,500 global business leaders shows that two-thirds (68%) of data available to companies goes unused or unanalyzed.
This data is entirely cost-effective since it is free to you, unlike second or third-party data, which is sold to companies in such need.
This data often includes:
- Data from behavior and actions are taken across your website or app
- Data stored in your CRM (ex. leads and customers info, surveys, notes, etc.)
- Subscription data

Organizing and taking control of the first-party data should be a priority for every company that wants to use its assets, deepen the relationship with the leads, customers, and scale up its business.
Any company not collecting and leveraging their first-party data to make decisions for future actions is tossing the money out the window.
Once you organize your data, integrate and track everything you can, the whole new world of KPI metrics opens up.
This way you will know where the bull’s eye is and how to hit it to scale up your business when you do the outreach.
What are the conversions?
Conversion is an activity when a lead completes a desired goal on your website, such as starting the subscription or downloading an e-book.
Conversions are usually split into two types:
- Soft conversions: form completion, demo, webinar or app signup, and the free trial start
- Hard conversions: the purchase or paid subscription
Naturally, the most relevant conversion is the hard one, thus the name.
Conversions might differ depending on your business goals and activities. At one point in time, you need more webinar signups because you wish to have as many viewers as you can to build up your community.
On the other hand, you might have an outreach campaign for a free trial, thus “free trial signups” are an obvious conversion.
Overall, you need to decide what conversion is for you for every sales or marketing activity and what type you wish to track.
This leads us back to our first point - track every piece of first-party data that you can. Trust us, Google Analytics and Google Tag manager might just become your best friends.
When doing cold outreach, tracking conversions is especially important because it reflects how effective your sales engagement efforts truly are.
To clarify, if, for example, your conversions are the number of calls scheduled or LinkedIn messages and email replies, you can track them throughout your CRM or Sales Management Tool to establish the effectiveness of your outreach efforts.
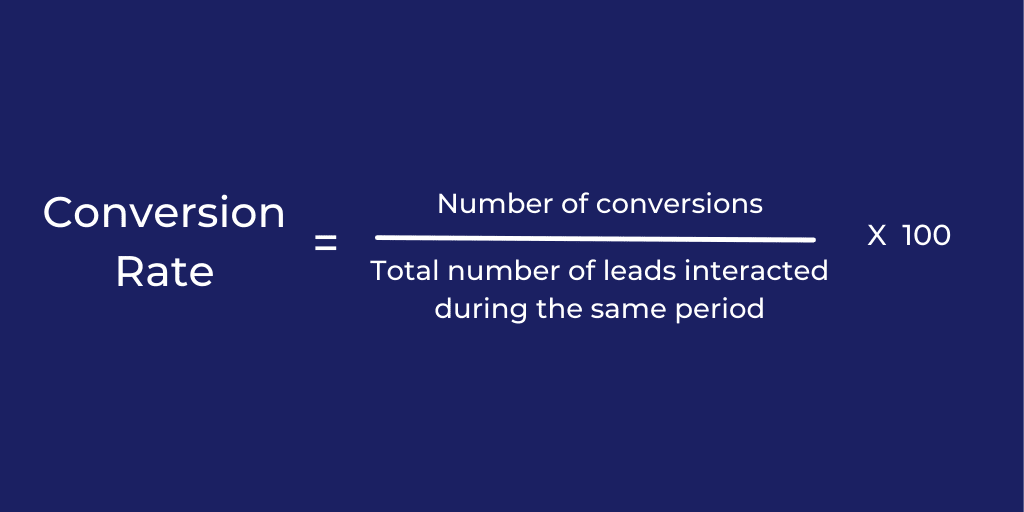
Know thy basic KPI: Conversion rate
When you know what conversion is and how to track it, you can then calculate what your conversion rate for a time span and sales or marketing activity is.
Example:
If in your cold outreach efforts you contacted 650 leads, and 45 of them converted, the calculation would be as follows:
Conversion Rate = (45 / 650) x 100 = 6.92%
Conversion is rarely single-sourced that's why it is integral to track the path to the conversion as well.
For instance, the lead might see your ad, then come to your website, download an eBook. After that they can see your Email or LinkedIn outreach, go back to sign up and create an account, triggering a so-called event. If you do not track your marketing and sales channels, you won’t know where that lead came from.
Now that we have our basics let’s jump into the essential KPIs for your business!
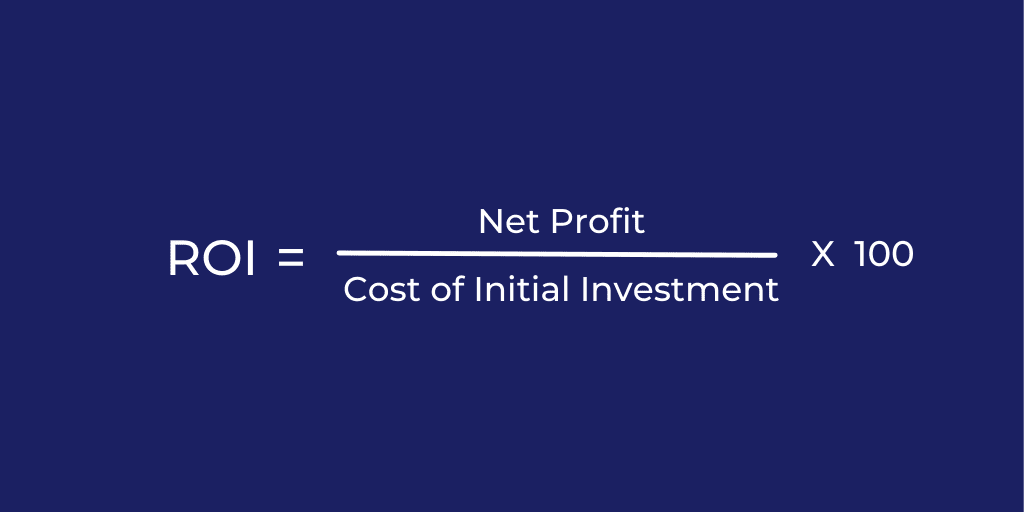
Return on investment - ROI
Return on Investment aka ROI is the measure of how profitable your investment in an activity, product, or service is. It can be used over different sectors across your company.
How to calculate ROI:
Example:
If you are using a Sales engagement platform such as Skylead, then you have a monthly subscription investment of $100. If, while using it, you record 9 hard conversions in a month with the $80 sale each, you will end up with the following calculation:
ROI = ( 9 x $80 / $100 ) x 100 = 720%
Why is it important?
One of the main advantages of this KPI is that it is a clear indication of how well your business is doing across sectors, what is profitable and what is not, and what you should change to scale up.
Customer lifetime value - LTV
Customer lifetime value shows the total worth of the customer to a business over their entire period of the relationship. It belongs to the finance, sales, and customer support sector of your company.
How to calculate LTV:
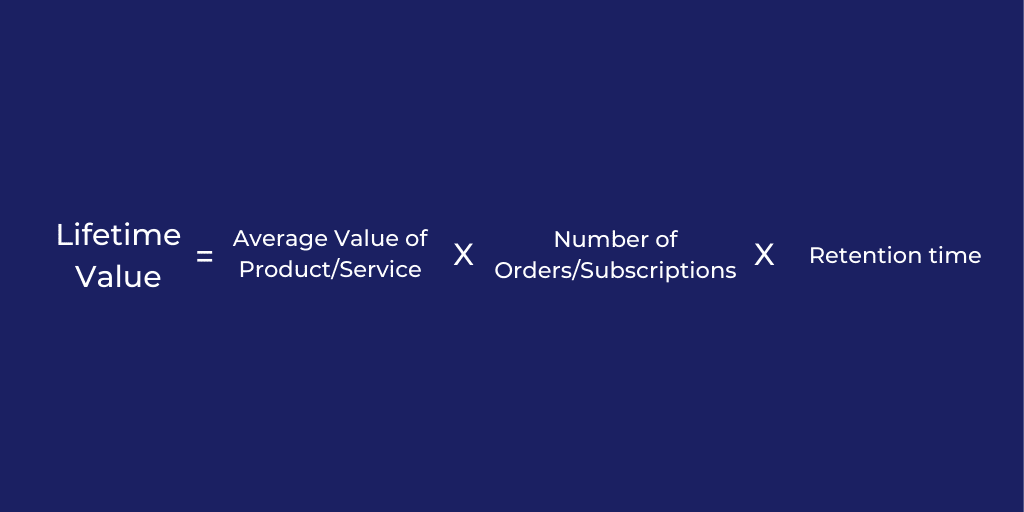
However, this can vary depending on the product or service monetization model, for example, one-time sale or monthly subscription service. In the end, you should report revenue from each customer throughout their relationship with your company.
Example:
You have a company which provides a subscription service with the price of $25 per month. If you wish to calculate how much value you would get from one customer in a span of three years time, it would go like this:
LTV = $25 x 12 ( number of subscriptions renewed per year) x 3 (years) = $900
Why is it important?
This KPI helps you understand who your most treasured customers are and to recognize new patterns or changes in how customers make a purchase and interact with the company.
Sales-wise, if you know your average LTV, you can easily understand what your most profitable ICP is (Ideal Customer Profile) and improve your sales targets.
While LinkedIn prospecting and one-time sales are constant activities, a consistent purchase or subscription behavior by loyal customers means you can easily predict revenue with more accuracy.
Furthermore, proper monitoring will help you boost customer retention, loyalty and create hyper-personalized messages for the customers.
And all this at the right time, at the right frequency, and even improve outreach to leads.
Know the history and what you earn from a constant customer. This way you can adjust activities to maximize profitability and continue to attract the right customers with your outreach.
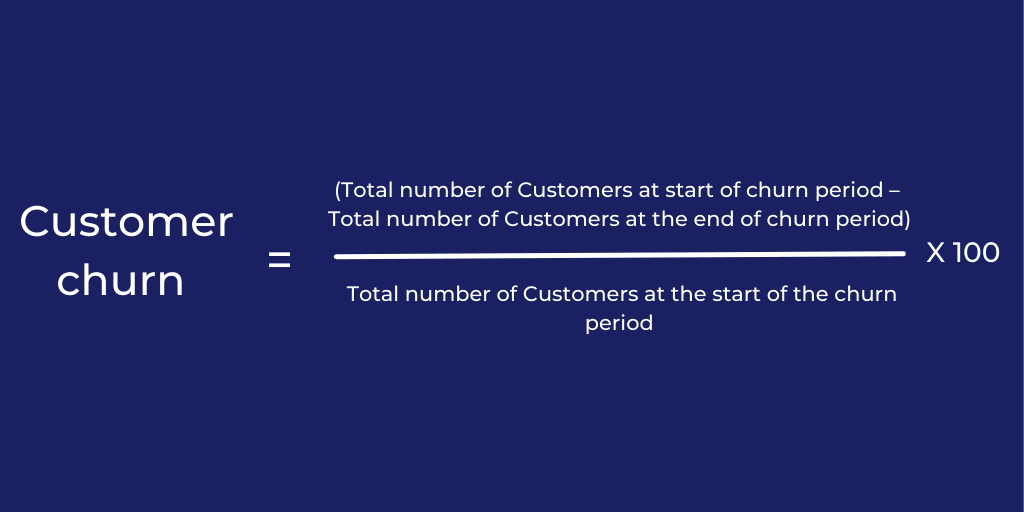
Customer retention and churn KPI
As relatively new B2B sales metrics, Customer Retention and Customer Churn took a swing at the beginning of the last year.
The same year when every possible business completely transferred online. These KPIs now present one of the most essential sales and customer success metrics.
Customer retention is the percentage of customers that remain active as users or buyers during one period of time.
On the other hand, Customer churn represents the rate of customers who canceled their service or stopped buying the products. Both KPIs are useful to track the length of a customer’s relationship with your company.
How to calculate customer churn:
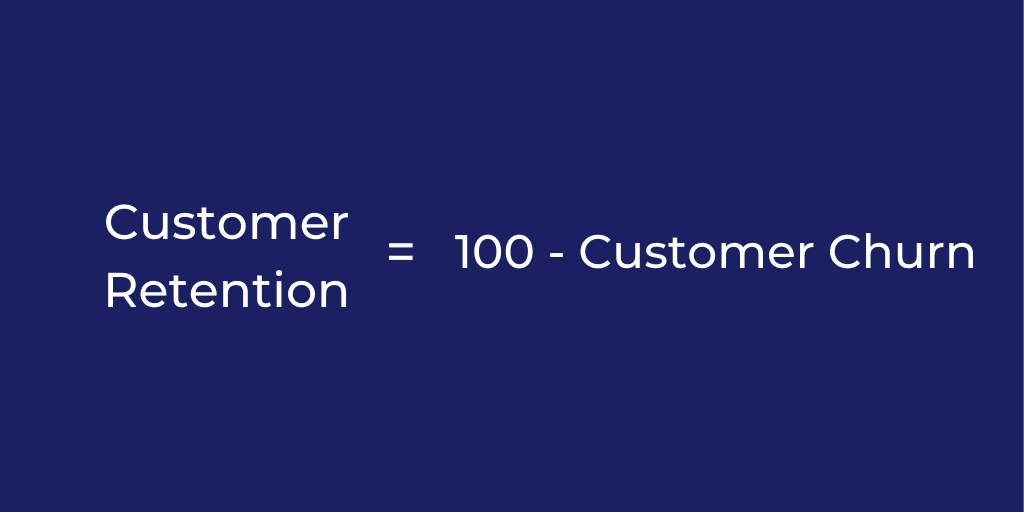
How to calculate customer retention:
Example being:
Say you have 60 customers at the start of the first quarter and only 40 customers at the end. Here’s how you would calculate churn and retention:
The difference between number of customers at the start and the end of churn period:
60 - 40 = 20
The difference between customer number divided by total number of customers at the start of the churn period:
20 / 60 = 0.33
Customer churn rate:
0.33 x 100 = 33%
Customer retention rate:
100 - 33 = 67%
Why is it important?
The main advantage of these KPIs is to see the customers outflow or growth in a certain time frame. Given the 2021 emphasis on customer lifetime value, customer retention/churn are its followers. These KPIs are essential to help you determine customer satisfaction and retention rates.
Customer acquisition cost - CAC
Customer Acquisition Cost is a metric that helps you determine the “cost” of acquiring new customers through different marketing and sales efforts. The lower CAC is, the better it is for your company. This simply means you’ve spent less money achieving hard conversion and gaining new customers.
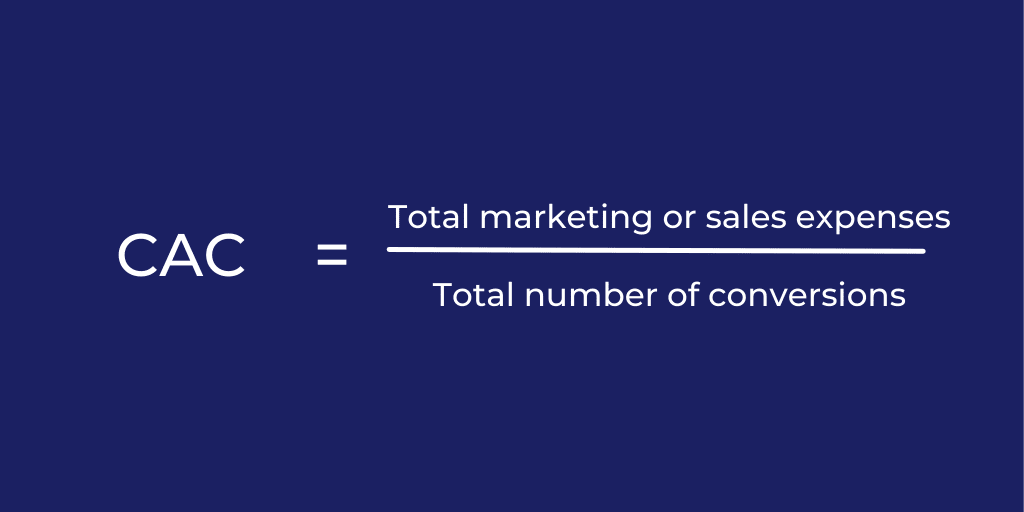
How to calculate Customer acquisition cost:
Example being:
Let’s say you invested $1500 in PPC in a month, and the total number of hard conversions is 50. The calculation would be:
Customer acquisition cost = 1500 / 50 = $30 per acquisition
Fairly good for the ongoing subscription monetization model. wouldn’t you agree?
Now let’s switch it up a bit. Imagine you are using a Sales engagement tool with an approximate price of $100 a month. During that time, using personalized and automated sales effort you gathered 30 hard conversions. The calculation would be:
CAC = 100 / 30 = $ 3.33
Now, this is a big difference in communication channels.
Why is it important?
CAC metric helps you peek into every sales and marketing activity and determine which ones are worth optimizing, or terminating. In other words, it helps improve ROI, profitability, and profit margin.
Bonus KPI: New vs. existing customers revenue percentage
Tale as old as time. Should you invest all the money and efforts towards new customers? Or should you leave some for the existing ones, as well? Of course, towards the new ones. But wait, what about the churn?
This is where the Percentage of Revenue from New vs. Existing customers come to the rescue. These KPIs show what your customer status is and where to shift your sales and support efforts.
According to the study, the probability of selling to an existing customer is 60-70%, while the same statistics for a new prospect is only 5% to 20%.
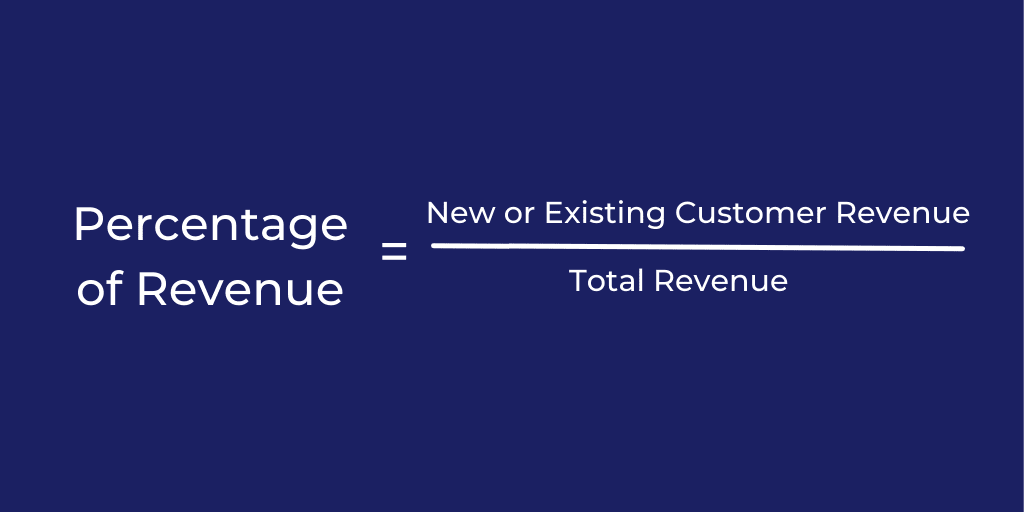
How to calculate Percentage of revenue of New vs. existing customers:
Why is it important?
Understanding and calculating the percentage of revenue from new and existing customers will give you greater insight into your business. For example, imagine if existing customers have a bigger percentage of total revenue. It can be an indicator of your Customer support team doing a great job in upselling and growing accounts.
But the sales team on the other hand, whose job is to acquire new customers, is falling behind.
If current clients' upselling is going great, this can be a sign that perhaps you should establish an inside sales team to continue the development of this business segment.
Another example. If new customers revenue is dropping, then it could be an indicator of a high churn rate or internal growth.
To understand what the case is for your business, it’s important to track LTV and ROI KPI, as well.
Summary
Tracking and analyzing your KPI metrics is not an easy feat, but we hope we've given you enough information to start with.
Remember, set your first-party data tracking thoroughly and determine what your conversions are. Only then will you be able to calculate your KPI metrics and perceive your overall business performance.
Finally, to sum up, here is an easy table with all the formulas.
| Conversion rate | CR = [Number of conversions / Total number of leads interacted during the same period] x 100 |
| Return on Investment | ROI = [Net Profit / Cost of Initial Investment] x 100 |
| Lifetime Value | LTV = Average Value of Product/Service × Number of Orders / Subscriptions × Retention time |
| Customer Retention / Churn | Customer churn = [Total number of Customers at end of churn period – Total number of Customers at the start of churn period] / Total number of Customers at the start of the churn period X 100 Customer retention = 100 – Customer churn |
| Customer Acquisition Cost | CAC = Total marketing or sales expenses / Total number of conversions |
| Percentage of Revenue from New vs. Existing Customers | PR = New or Existing Customer Revenue / Total Revenue |
There you are, folks!
This is just a small part of how to successfully scale up your business and outreach with more ease! In the spirit of the Christmas season beginning, we wish you Happy data gathering and Merry analyzing.
Crave to maximize your communication efforts and make the best out of your outreach? Sign up for a 7-day Free Trial and see Skylead in action!